

At Lincoln Loop, we don’t just build web platforms from scratch and scale them to accommodate growing demand; we also dedicate ourselves to their long-term maintenance. Some of our partnerships have spanned over a decade.
Let me walk you through a performance optimization journey we undertook with a large publishing platform, which serves hundreds of thousands to millions of page views daily.
The Issue at Hand
Over the lifespan of a platform, various infrastructure changes and design tweaks can inadvertently impact the response time. For instance, adding more content to a page or changing the ordering of the results might bog it down. Continuous monitoring is critical because it allows us to spot such regressions quickly.
A live website’s behavior varies significantly from local testing. Production sites deal with multiple cache layers and handle countless concurrent requests. In contrast, during “local” development, you typically turn off these cache layers and test one endpoint at a time.
Thus, when embarking on performance optimization, always base your strategy on metrics from your production environment and tackle one modification at a time.
For this optimization, I utilized AWS CloudWatch for response time metrics on the load balancer and some data from Sentry’s performance analysis.
Here is Sentry’s trend graph for the URL endpoint we are optimizing.
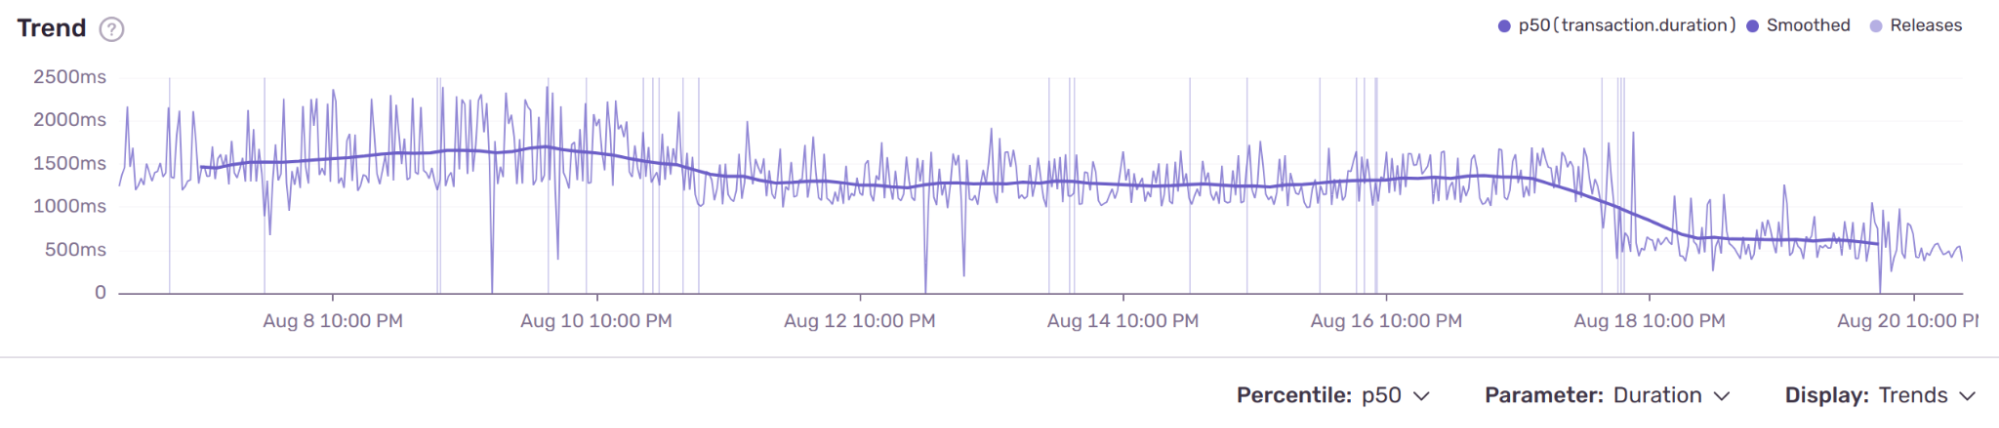
Performance optimization can be a bottomless rabbit hole, so it is essential to start this process with a solid set of metrics around your production environment and only do one modification at a time.
The Diagnosis
The first step is to Identify the URLs causing the most significant slowdowns, or as we call them, the “offending URL families.”
Displaying a list of URL families in reverse order of “user misery” will give us the starting point.
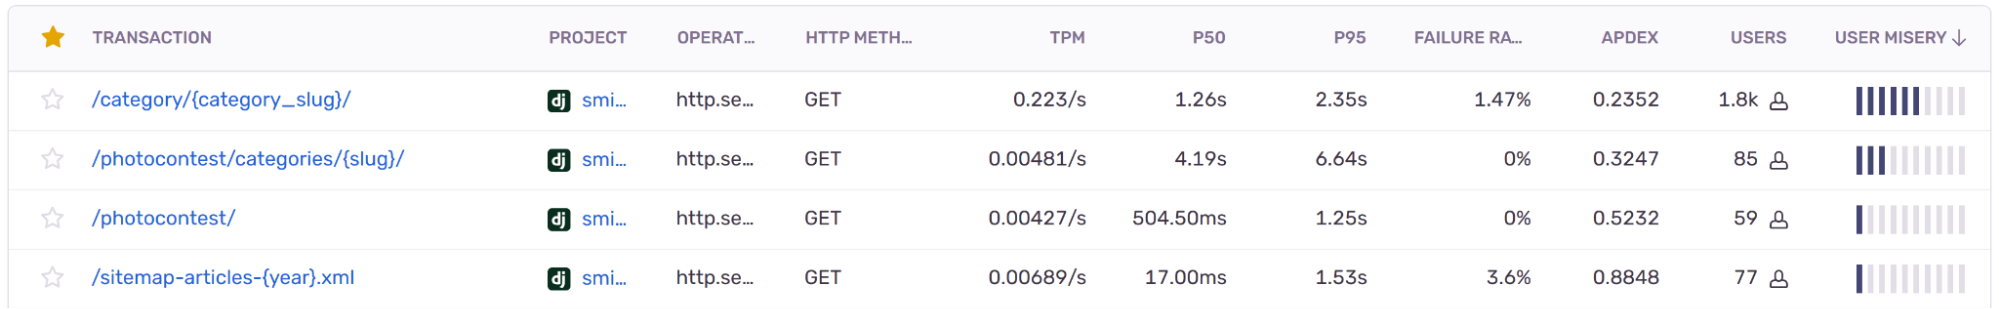
Our prime suspect was the “/category/{category_slug}/” URL. At its heart, this view simply offers a paginated list of articles.
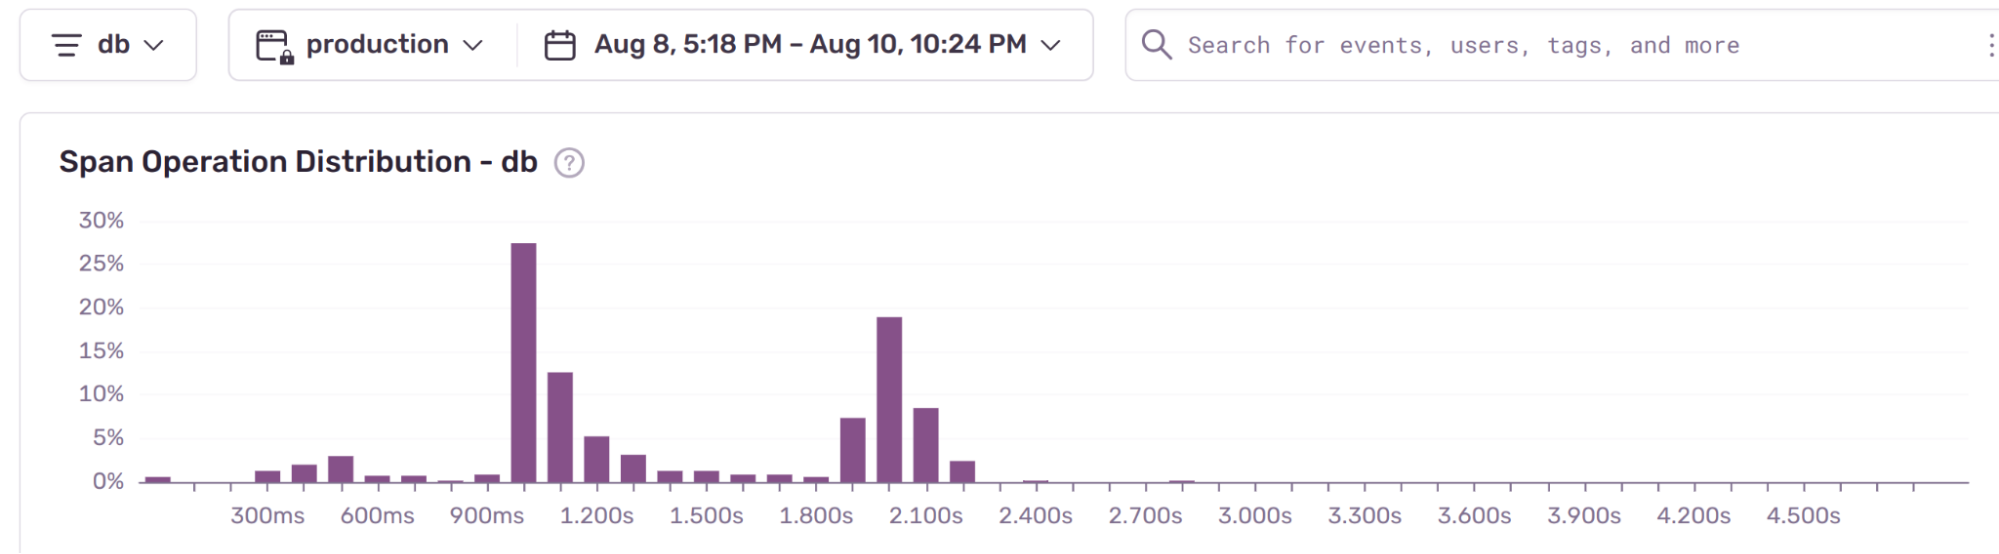
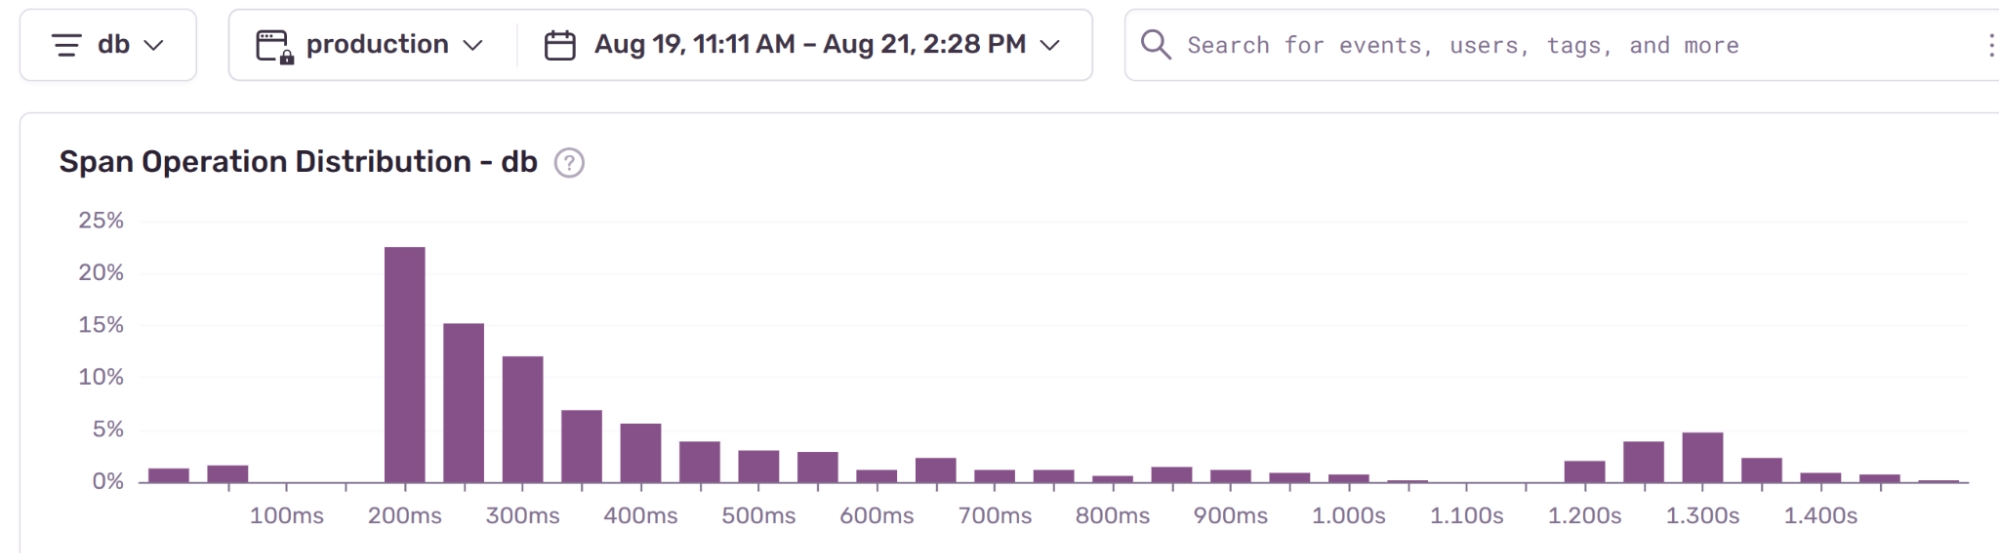
A closer examination of a Sentry event trace confirmed our suspicions: we were database (DB) bound. This is a common issue for content-rich sites.
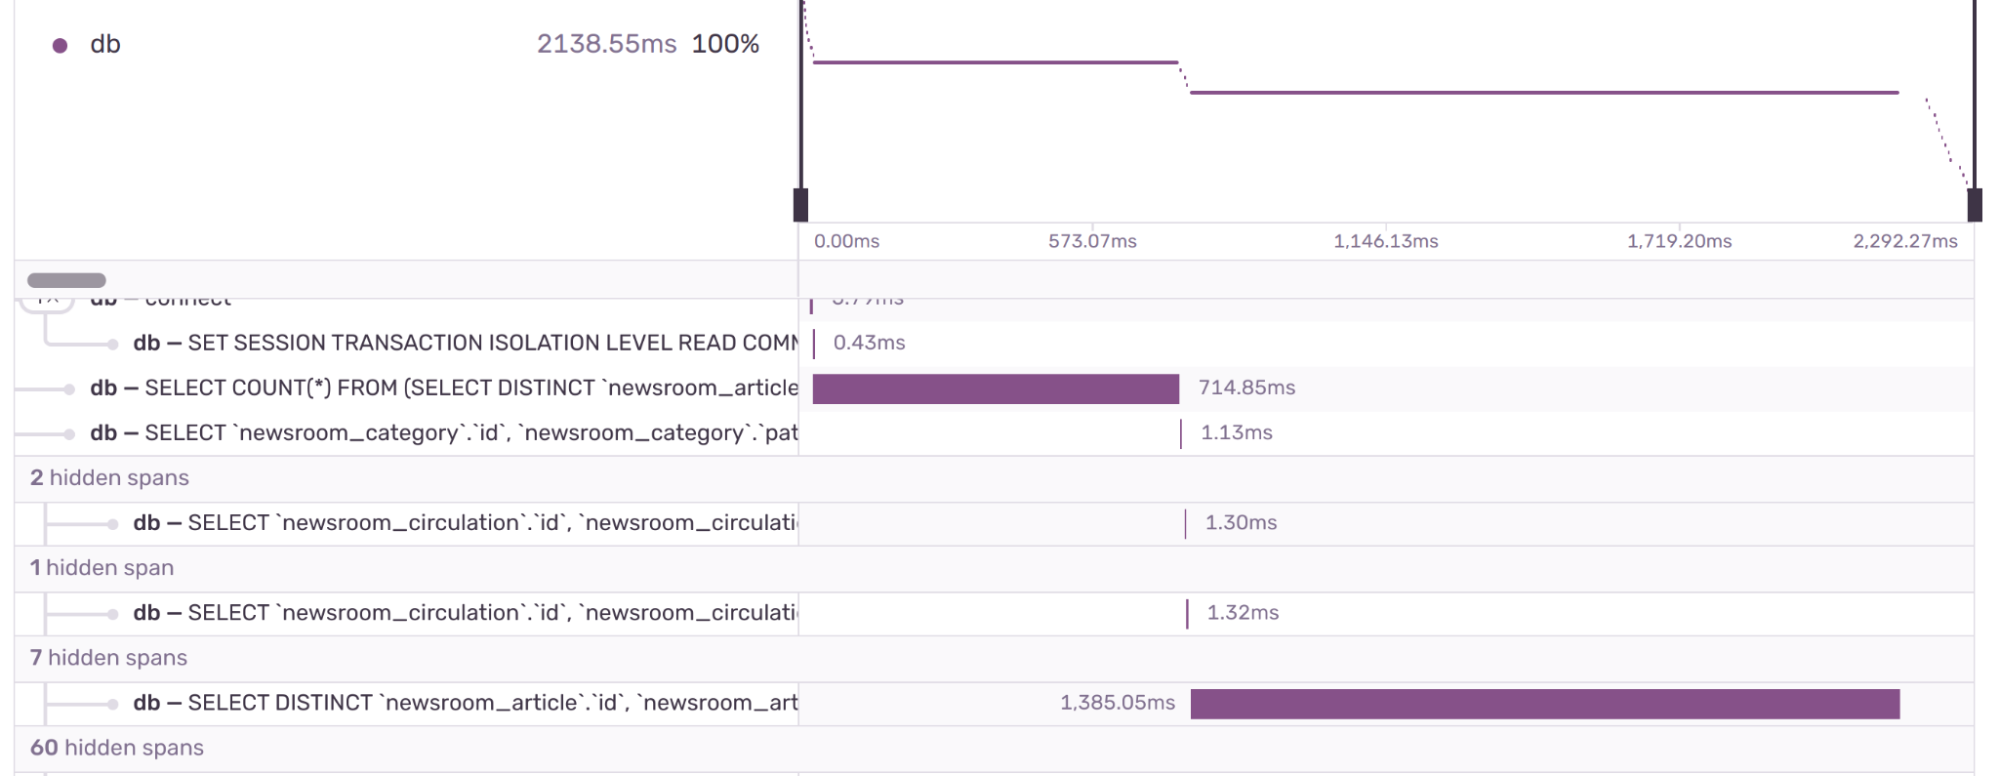
Reproducing the issue locally, I wanted to inspect the generated query. For this, I utilized the kolo.app VSCode extension, known for its impressive visualization flamegraph.
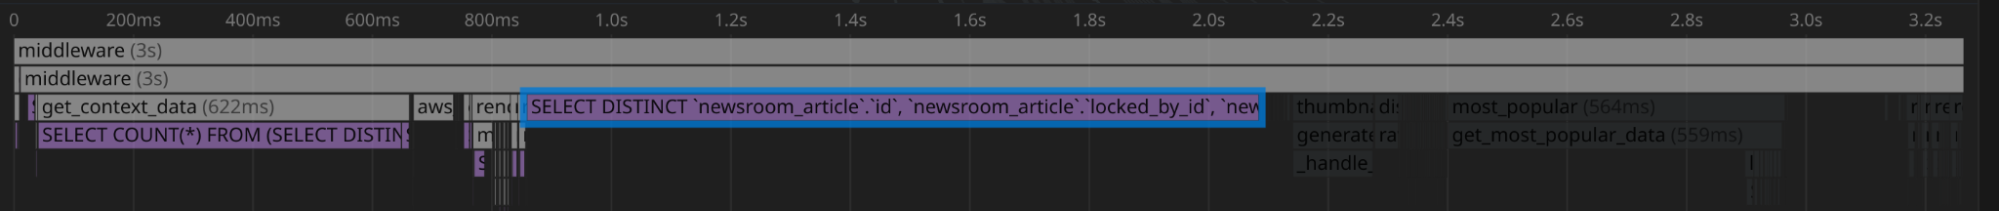
The flame graph spotlighted two problematic queries. A closer look revealed these stemmed from the get_query_set method on the view and Django’s default paginator, which employs .count() to calculate page numbers.
The general shape of the SQL query
SELECT
  DISTINCT `newsroom_article`.`id`,
 -- < +130 SQLfields>
  COALESCE(
    `newsroom_article`.`updated_at`,
    `newsroom_article`.`publication_start_date`
  ) AS `latest_date`,
FROM
  `newsroom_article`
  LEFT OUTER JOIN `newsroom_article_additional_categories` ON (
    `newsroom_article`.`id` = `newsroom_article_additional_categories`.`article_id`
  )
  INNER JOIN `newsroom_category` T4 ON (`newsroom_article`.`primary_category_id` = T4.`id`)
  LEFT OUTER JOIN `filer_override_image` ON (
    `newsroom_article`.`image_id` = `filer_override_image`.`file_ptr_id`
  )
  LEFT OUTER JOIN `filer_file` ON (
    `filer_override_image`.`file_ptr_id` = `filer_file`.`id`
  )
WHERE
  (
    `newsroom_article`.`publication_start_date` <= '2023-08-21 12:10:00'
    AND `newsroom_article`.`state` = 20
    AND (
      `newsroom_article`.`publication_end_date` IS NULL
      OR `newsroom_article`.`publication_end_date` >= '2023-08-21 12:10:00'
    )
    AND (
      `newsroom_article_additional_categories`.`category_id` = 19
      OR `newsroom_article`.`primary_category_id` = 19
    )
  )
ORDER BY
  latest_date DESC
LIMIT
  20
The Solution
Modification 1: Retrieve Only What’s Necessary
I began by trimming the fat. Instead of fetching every field (more than 130), I focused on retrieving only the essential fields:
@@ -270,9 +270,27 @@ class ArticleCategoryList(ListView):
             )
             .annotate(latest_date=Coalesce("updated_at", "publication_start_date"))
             .select_related("primary_category", "image")
-            .prefetch_related("specials", "creators")
+            .prefetch_related(
+                "specials",
+                "series_tag",
+                # "creators",
+            )
             .distinct()
             .order_by("-latest_date")
+            .only(
+                "headline",
+                "slug",
+                "proxy",
+                "summary",
+                "publication_start_date",
+                "magazine_issue_date",
+                "issue_link",
+                "updated_at",
+                "series_tag",
+                "image",
+                "primary_category",
+                "specials",
+            )
         )
         qs = request_db_router(qs, request=self.request)
         return qs
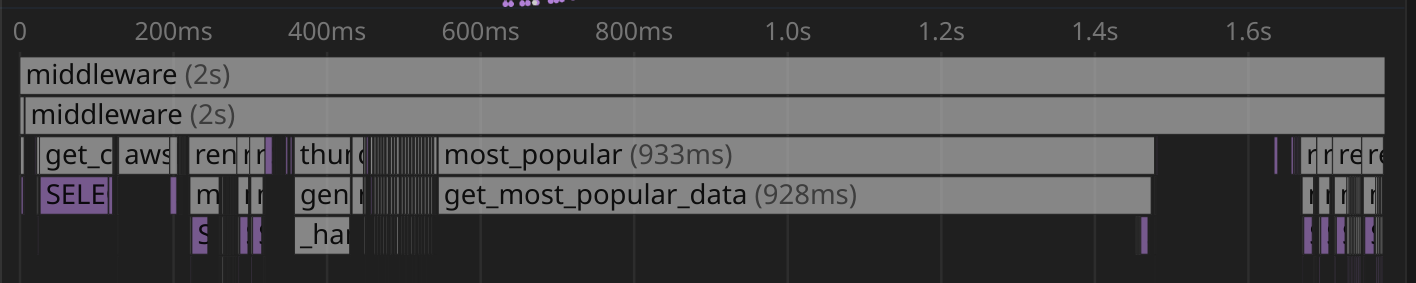
This adjustment significantly reduced the .count() time from 607ms to 212ms and the article data query time from 1224ms to 858ms.
Modification 2: Static latest_date Calculation
Our next hurdle was ordering tables based on a latest_date, computed at query time using MySQL’s coalesce function.
  COALESCE(
    `newsroom_article`.`updated_at`,
    `newsroom_article`.`publication_start_date`
  ) AS `latest_date`,
To avoid this query time computation, we will denormalize latest_date into a statically saved field called publication_order_date generated when an article is saved. I will skip over the migration process.
@@ .... @@ class Article(TimeStampedModel, BaseSocialMetaMixin, LockModel):

         return byline

+    def set_publication_order_date(self):
+        if self.updated_at:
+            self.publication_order_date = self.updated_at
+        elif self.publication_start_date:
+            self.publication_order_date = self.publication_start_date
+
+    def save(self, *args, **kwargs):
+        self.set_publication_order_date()
+        super().save(*args, **kwargs)
+
     class Meta:
         app_label: str = "newsroom"
-        ordering = ["-updated_at", "-publication_start_date", "-pk"]
+        ordering = ["-publication_order_date", "-pk"]
         indexes = [
             models.Index(
-                fields=["state", "publication_start_date", "publication_end_date"],
+                fields=[
+                    "state",
+                    "primary_category_id",
+                    "publication_start_date",
+                    "publication_end_date",
+                    "publication_order_date",
+                ],
                 name="art_state_pub_start_and_end",
             )
         ]
This change has a profound impact on the query time that we can no longer see it on the flame graph. The query is now taking 9ms instead of 858ms.
The subquery used by the paginator to do the .count() is still fetching more data than it should.
Modification 3: count
Restrict the data fetched by the subquery used by to count the articles.
@@ -291,6 +291,8 @@ class ArticleCategoryList(ListView):
             )
         )
         qs = request_db_router(qs, request=self.request)
+        # The trick below is a query optimization to avoid retrieving unnecessary fields for the count in the paginator
+        qs.count = qs.only("id").count
         return qs
Now that we only retrieve data we are interested in, the .count() went from 212ms to 87ms.
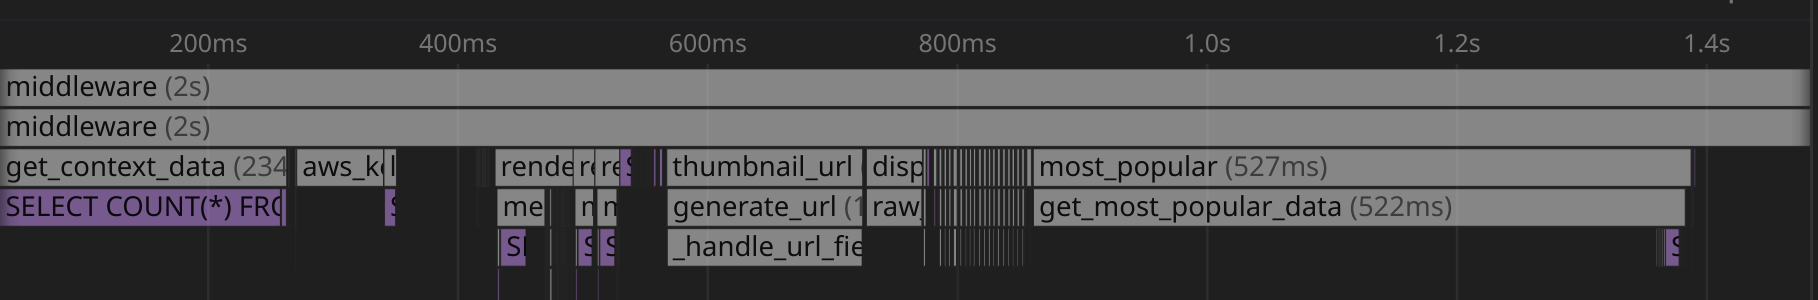
Besides the three primary changes detailed earlier, I’ve implemented several other minor modifications. These collectively reduced the total queries on that view from 66 to 47. While each query might have taken only a few milliseconds, the cumulative effect can be significant on a busy database server.
In conclusion, the above discussion illustrates how, with relatively minimal code adjustments, you can enhance database performance by nearly 19 times when retrieving crucial data.